
[Source: Geekwire] Seattle Mayor Ed Murray signs an open data executive order on Friday at Impact HUB in downtown Seattle.
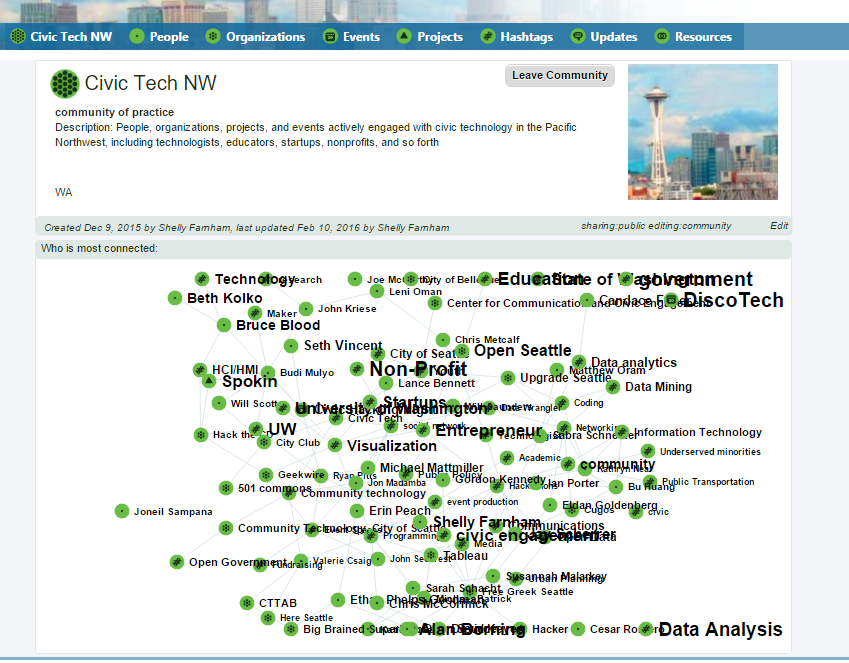
As users of the City of Seattle’s open data, we’ve been really excited about the proactive stance the City has been taking toward increasing transparency and engagement with citizens through their Open Data program. They recently “launched” a new Open Data Policy, formalized by having the Mayor sign the document, and where we were invited to demo Spokin.
A few people in the audience were asking “why is this important”, and here’s the article on Geekwire summarizing the event.
I think however the best summary of why it is important came from Michael Mattmiller’s email invitation to the event, which is excerpted here (I was assured, all of their emails are considered public):
At this week’s State of the City speech, Mayor Ed Murray announced his commitment to open data and his intention to sign an executive order making Seattle “Open by Preference”. I invite you to join us for the signing of the Mayor’s Open Data Executive Order on Friday, February 26th at 9 am at Impact Hub (220 2nd Ave S, Seattle, WA).
The executive order, and the new City Open Data Policy it implements, notes that we will strive to make data collected or generated by the City available to the public through our open data portal,data.seattle.gov. This is a major step forward for our Open Data Program, which today contains more than 440 datasets. Our new Policy is a product of collaboration between the City of Seattle, the Sunlight Foundation, Bloomberg Philanthropies’ What Works Cities, the University of Washington, and many of you. Highlights from the new policy include:
* Data will be published in a machine-readable format, wherever possible
* Planning for data publication should occur when planning for new projects and programs
* Departments will appoint Open Data Champions who will be accountable for maintaining their department’s data catalog and ensuring that published data is refreshed on a regular basis
* A recognition that stakeholders must be engaged to prioritize datasets for release and ensure that the data best fits intended uses
* Datasets will be reviewed for privacy considerations prior to publishing, and the entire Open Data Program will undergo an annual risk assessment to identify potential data aggregation concerns
The full text of the policy is published to our site at this link.
“Open by preference” is a standard that balances the City’s desire to be as open as possible with our commitments to protecting privacy and security. This is an issue many municipal governments have faced and is often cited as the primary reason not to pursue an open data policy. By proving that it is possible to be open while protecting privacy and security, the City of Seattle is opening a path for other cities, including our neighbors in Bellevue and Tacoma, who have also been working with the Sunlight Foundation through Bloomberg Philanthropies’ national What Works Cities initiative to stand up their own open data policies in the coming year.
As we implement our new policy, we look forward to engaging you and a broad set of stakeholders to prioritize datasets to be made open, better understand use cases, and release data in formats that increase usability.
Please RSVP to [email removed] if you are able to join us. Thank you again for your ongoing input, engagement, and support.
Regards,
Michael
Michael Mattmiller
Chief Technology Officer | City of Seattle
Director | Department of Information Technology
The most novel aspect of this policy is the “Open by preference” component, where each department will be in a position to assess the risks associated with publishing their data, and take the necessary steps to mitigate the risk. Here are the three sections of the policy that speak to this directly:
Section 1: Open by Preference
E. While a preference is towards making all data public, some data elements if released, especially in bulk, could cause privacy harms, put critical infrastructure at risk, or put public safety personnel and initiatives at risk. City departments and offices should use tools provided by the Open Data Program to assess risk as part of determining datasets to be released.
F. The requirements set forth in the policy shall be integrated into the Municipal Information Technology Investment Evaluation (MITIE) process, questionnaire and checklists to help facilitate consistent identification and publishing of datasets as the City plans for the implementation of new technologies and systems.
G. Should the Open Data Program discover that data is being used in ways that violate privacy, puts the public at risk, or contravene the Program’s goals, the City of Seattle and parties acting on its behalf have the right and responsibility to take any action necessary to mitigate these risks.
My hope is some of this open by preference sentiment will percolate down to individual people themselves — that is, as they provide data, they are given the open to share it or not. I think, if framed appropriately in how their can really help the City and its citizens make smarter decisions, a lot of people would be quite happy to share data that might be considered too sensitive at the departmental level.