
This past weekend I attended “HackHousing”, a hackathon hosted by Zillow in coordination with the White House, U.S. Department of Commerce and theDepartment of Housing and Urban Development and in partnership with the Department of Computer Science & Engineering at the University of Washington.
It was a great hackathon, very well attended and facilitated by Chris Metcalf from Socrata.
I was very lucky with my impromptu team (Saba, Daniel, Elizabeth, and Jim), who were excited to do a project exploring how can we indicate that a neighborhood has a thriving community based on open data. Building on a long history of research showing that thriving communities are more likely to grow when there are “third places” in a centralized location, we created a heatmap quantifying the number of third places in a neighborhood and the neighborhood’s community “hubbiness”.
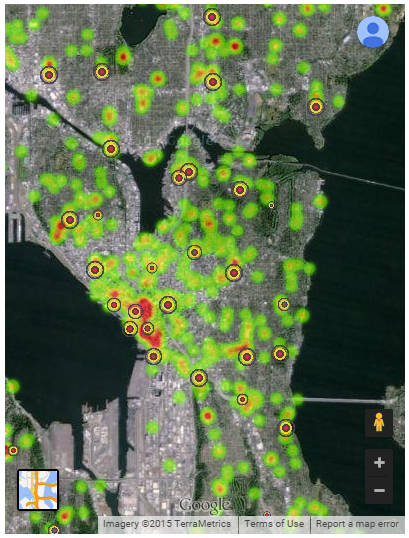
Apolis, with heatmap indicating community places, and bullseyes indicating neighborhood community centroid & density
In addition to the heatmap, we found the centroid and density of each neighborhood’s hubs and represented them with little bullseye’s on the map (larger bullseye = more third place density) so people would know where they should live.
We used the City of Seattle’s neighborhood map data to find places such as libraries, parks, community centers, and schools.
We also used the Location Affordability Index open data provided by HUD for the event to help people filter over the map.
The code is shared on github here.